
The Concordance Conundrum: Are SAT and ACT Scores Still Comparable?
Does the 2018 concordance table remain valid?
While comparing students’ SAT and ACT diagnostic results to make recommendations for which test is a better individual fit, we’ve noticed an interesting trend: the most recent SAT and ACT percentiles may no longer align with the SAT/ACT concordance table released in 2018.
There are important implications for this discrepancy. After analyzing various data surrounding the SAT/ACT concordance and percentiles, we’ve concluded the following: if admissions offices continue to treat the current concordance table as gospel, SAT scores may be viewed as less competitive, while ACT scores may be considered more favorably.
Right now ACT test takers could have a slight advantage that will likely increase if the concordance is not updated.
The Official Concordance Table
The SAT and ACT have a good deal of overlap. Much of the content on both tests is interchangeable, and, save for the several dozen higher education institutions that have a test-blind admissions process, the SAT and the ACT are given equal preference at all U.S. colleges and universities – and at most schools internationally that accept these tests. Where the SAT and ACT may differ most is in structure and scoring. The SAT has two sections, each scored out of a maximum of 800 points, combining for a composite score out of 1600; the ACT has four sections, each scored out of 36 points, averaged for a composite score out of 36. In order to leverage two vastly different scoring scales to figure out the relative strength of a student’s results, a consistent comparison rubric is essential.
In 2018, the College Board (the company that creates and administers the SAT) and ACT Inc. joint-released this crucial reference document, which offers a straightforward, side-by-side comparison of scores from both tests. This official concordance table was created as a response to the 2016 SAT redesign and subsequent requests from universities and other stakeholders for reliable data comparing the revised test with the ACT.
Researchers from the College Board and ACT Inc. partnered with the NCAA Technical Advisory Board to create a “single source of reference.” The group of researchers aggregated data from nearly 600,000 test takers from the graduating high school class of 2017 who took both the ACT and redesigned SAT. The sample was then “statistically weighted to reflect the demographics, school attributes, and high school grade point average (GPA) of all students who are likely to take the ACT, SAT, or both tests.”
A snapshot of the table is included below:
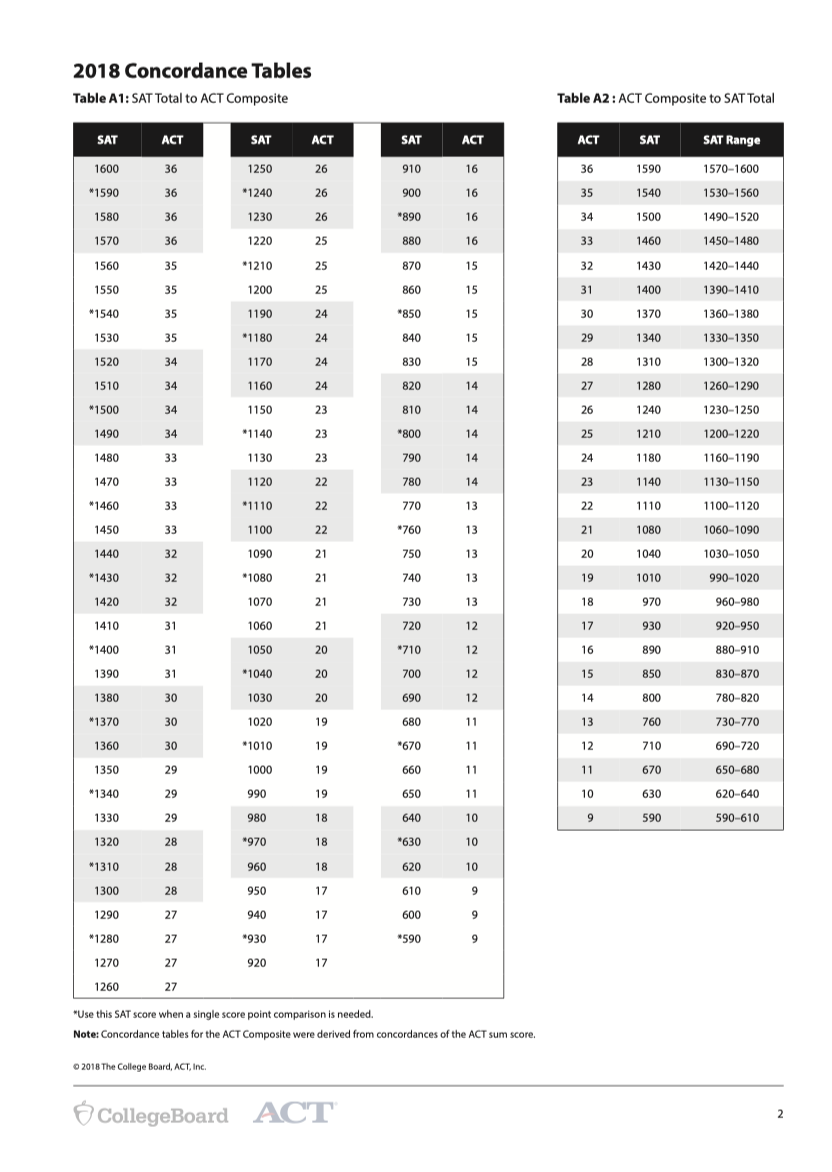
Admissions officers, college counselors, test prep tutors, and other stakeholders are no doubt intimately familiar with the above document, which, since its release in 2018, has been the sole comparison document of the tests. Many college-bound students have likely used this reference as one of the initial steps in deciding which test is best for them.
Nevertheless, much has changed in higher education since the official concordance table was released. In light of a pandemic, the consequent shift in admissions policies, and a major test redesign, we wanted to see if we could find evidence on whether this document is still as valid a comparison as it was six years ago.
The SAT Redesign
One of the most glaring shifts in the testing landscape since the concordance document was created is that the SAT has undergone another redesign, switching from a paper-based test to a computer-adaptive testing platform. With the new system come some notable scoring differences. Although the sections are both still scored out of 800, questions are no longer equally weighted; missing a question can now cost a student between 0 and 40 points, which is a departure from the previous iteration of the SAT and the current ACT. Unlike the redesigned SAT, for both of these tests, although each testing administration is graded on a curve, every correct answer will add a point to a student’s raw score on each section.
In general, the College Board has been somewhat cagey about the revised scoring, offering no official explanations on why certain questions carry more weight than others. Moreover, no official past tests have been publicly-released since the digital SAT debuted (outside of the U.S.) in January 2023. By comparison, the ACT and paper-based SAT have offered students the option of purchasing full tests after certain administrations with their Test Information Release (TIR) and Question-and-Answer Service (QAS), respectively.
Because of the lingering unknowns surrounding the digital SAT, it is too early to make solid judgments about how test changes have affected the scoring relationship with the ACT. Questions about the validity of the current concordance, however, extend beyond any lack of transparency surrounding the redesigned SAT.
National Percentiles
In addition to the concordance table, one can get a snapshot of comparison using percentiles released by both ACT, Inc and the College Board. The ACT percentiles are “based on ACT-tested high school graduates of 2021, 2022, and 2023” and are valid for tests from September 2023 to August 2024. The College Board releases two sets of percentiles for the SAT:
- “Nationally Representative Percentiles,” which are based on a research study of juniors and senior at U.S. high schools and weighted to represent all such U.S. students in those grades
- “User Group Percentiles,” which are based on the actual SAT scores from college-bound students from the past three years
Looking at the national percentiles across the two tests, there is clear parity with the concordance table.
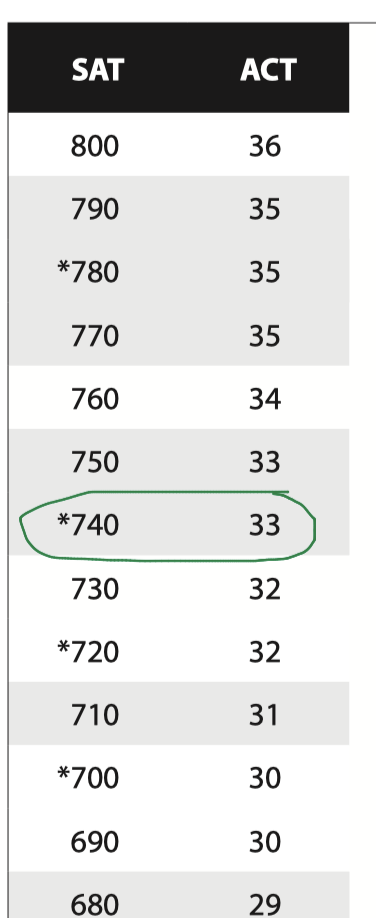
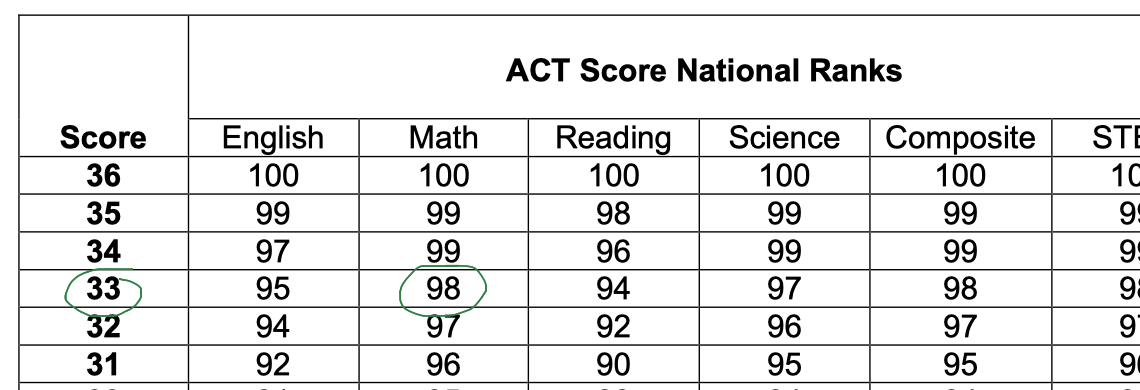
Let’s take two math scores that are equivalent on the concordance table: 33 (ACT) and 740 (SAT).
Scoring a 33 on the ACT Math would put a student in the 98th national percentile:
Scoring a 740 on the SAT Math would also put a student in the 98th percentile nationally:
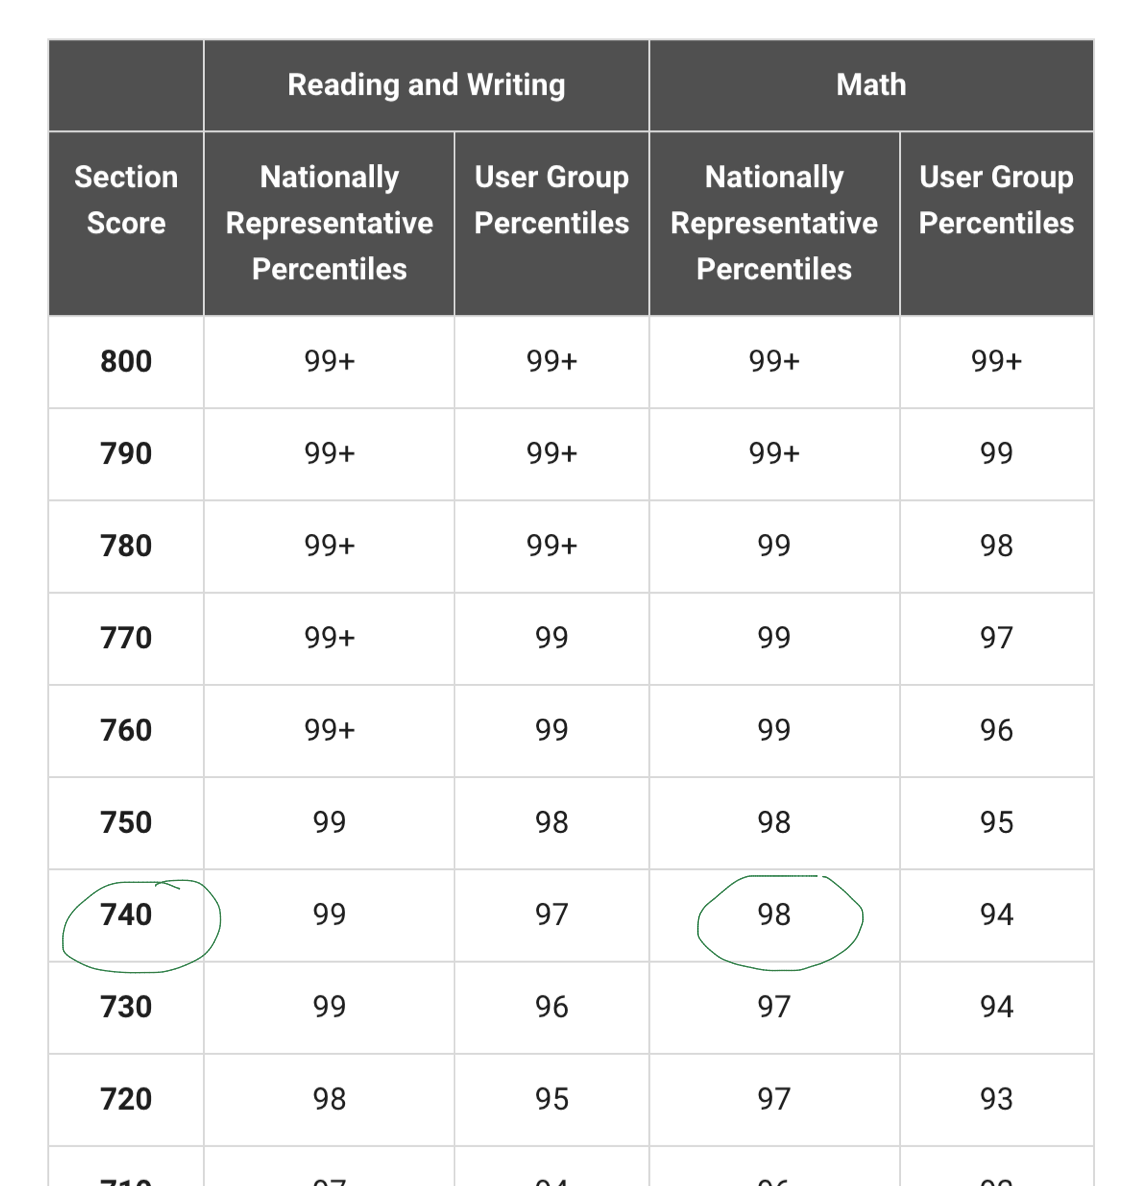
However, a 740 would only put that student in the 94th percentile within the User Group.
The disparities between the two groups, though noteworthy, do not seem to have much impact on admissions. We looked at the testing data from the top 50 ranked national universities. Taking each university’s self-reported Middle 50 percent of SAT scores, we calculated what the corresponding ACT scores would be based on the 2018 concordance table. We then compared those scores to the true Middle 50 percent of ACT scores for their admitted class reported by each institution.
In the end, we found negligible statistical deviation. This tells us that admissions officers are generally following the national percentiles (not user group percentiles), and, by extension, the concordance table when it comes to test scores.
Shifting Percentages of Mandated Testers
The impact of the pandemic and subsequent test-optional surge seemed too much of a sea change to not have influenced the test concordance. In order to see any discrepancies, we had to dig deeper into the available data.
We started with the fact that the SAT reports separate national and user group percentiles, while the ACT does not. Nearly every possible score on the SAT will correspond to a lower user percentile than the national percentile; this helps illustrate that the scores of students who plan to submit their scores to colleges tend to be more competitive than the national scores, as the latter include the scores of students who take the tests as part of statewide requirements. The fact that ACT scores have been trending downward in recent years likely points to a smaller ACT user group. Although we do not have enough data to reverse-engineer ACT user group percentiles, concentrating on states with testing requirements yielded interesting findings.
There are currently fifteen U.S. states that mandate students take the ACT in their junior year as part of a statewide requirement. Comparatively there are nine states and Washington D.C. that have similar SAT obligations. Using records from the National Center for Education Statistics, we looked at the number of students who graduated in the class of 2017 – the data year used to build the concordance table – and the projections for the number of students who graduated in 2023 – the most recent year with testing data available – across all of these states. We then calculated the approximate number of those students who took the ACT or SAT based on reports by the College Board and ACT Inc., which provided the percentage of students who took the test in each state for each key graduation year.
This data is, of course, not perfect. Just because a student tests in an SAT- or ACT-mandated state does not mean that student will not also submit their scores when applying to colleges. However, using data for both the SAT and the ACT will help balance our results. Moreover, the disparity here is considerable.
The approximate number of students who took the SAT in the SAT-required states dropped from 402,501 (class of 2017) to 398,275 (class of 2023) for a total loss of 4,226 testers, while the approximate number of students who took the ACT in the ACT-required states rose from 505,222 (class of 2017) to 525,544 (class of 2023) for a total gain of 20,332 testers. A change in over 24,000 testers across those five years is significant, and corresponds with the fact that the ACT has expanded its reach with state education systems.
We see an even more striking contrast, however, if we compare the total number of SAT and ACT testers from those classes. This is owed, in part, to the fact that, while the total number of SAT testers has increased from 2017 (1,715,481) to 2023 (1,913,742), the total number of ACT testers has experienced a notable decline in the same time span (2,030,038 in 2017 to 1,386,335 in 2023).
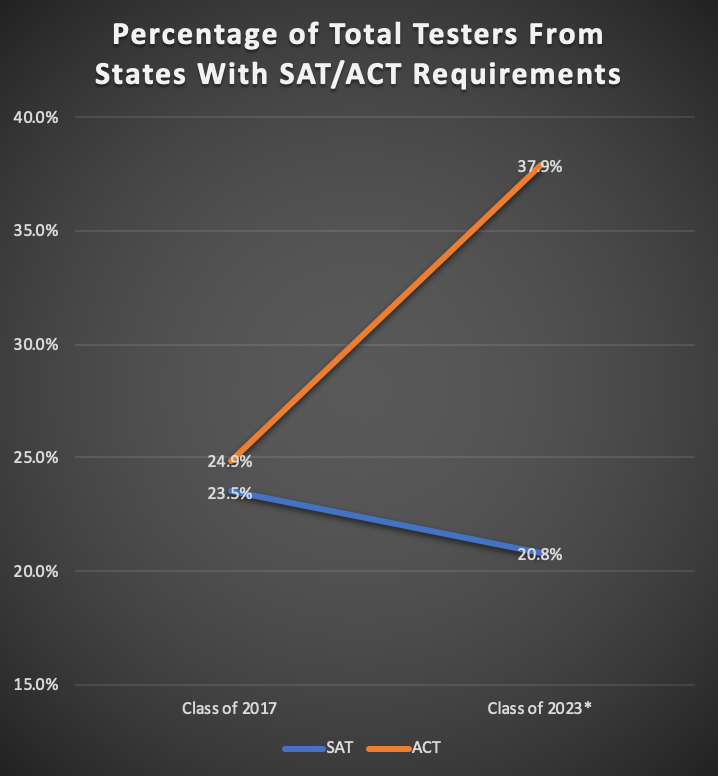
For the class of 2017, the number of students who took the SAT in the SAT-mandated states accounted for 23.5% of the total test takers that year. Based on the projections for the class of 2023, that percentage dropped to 20.8%.
For the class of 2017, the number of students who took the ACT in the ACT-mandated states accounted for 24.9% of the total test takers that year. Based on the projections for the class of 2023, that percentage jumped – dramatically – to 37.9%.
* projected (in part)
Therefore, when the data used to build the official concordance table was being gathered, there was a similar percentage of SAT and ACT testers who were from states where that test was mandated: these figures were separated by 1.4 percentage points. According to projections from six years later, this is no longer the case: the separation has increased significantly to 17.1 percentage points.
Takeaways:
Because the overall number of ACT takers has shrunk, while at the same time the number of students taking state-mandated ACTs (which include a higher non-college bound percentage) has risen, the percentage of ACT students who are not necessarily college-bound has risen significantly. Therefore, college-bound ACT test takers are now in a less competitive pool than they were when the concordance table was released six years ago.
When using the concordance table to compare ACT scores to SAT scores, this difference is exacerbated by the fact that the opposite shift has happened with the SAT. More overall students are taking the test, but fewer are state-mandated students, thus shrinking the overall percentage of non-college bound students in the SAT pool and making that pool more competitive. In short, there is real reason to believe that college-bound, competitive test takers currently have an advantage on the ACT if universities adhere to the concordance table.
Further complicating the picture are the unknowns surrounding the digital SAT and whether it has a true concordance with the previous paper-based SAT and, thus, to the 2018 ACT and ACT today. The bottom line is that all these factors cast doubt on the concordance table in its current form and its heavy use as a guide in college admissions; it is in urgent need of an update.
Written by
Zachary Adler
 Since 2010, Zach has been helping students achieve their college readiness goals, specializing in all sections of the SAT, ACT, PSAT, and SHSAT. Prior to joining Onsen, Zach worked for a global investment firm, as well as in various roles in the education space. He has served as a youth mentor and has run college readiness information sessions for students in under-resourced communities. Additionally, Zach is a writer and filmmaker. He is an International Baccalaureate scholar and a graduate of Boston University.